Why a $50 million gap can grow over time
The central distinction is between today's residual funding requirement and the amount that may actually be needed when construction contracts are awarded years later.
Visual evidence
Images are supplemental. The factual claims on this page are intended to remain traceable to the primary-source links below.
The City's three-number breakdown
| Component | Amount | Meaning |
|---|---|---|
| Total facility program | $69.25M | Current estimated total cost of the three priority facilities. |
| Existing/identified funding | −≈$19.3M | Funding already identified through grants, impact fees and other sources; not assumed to be unrestricted. |
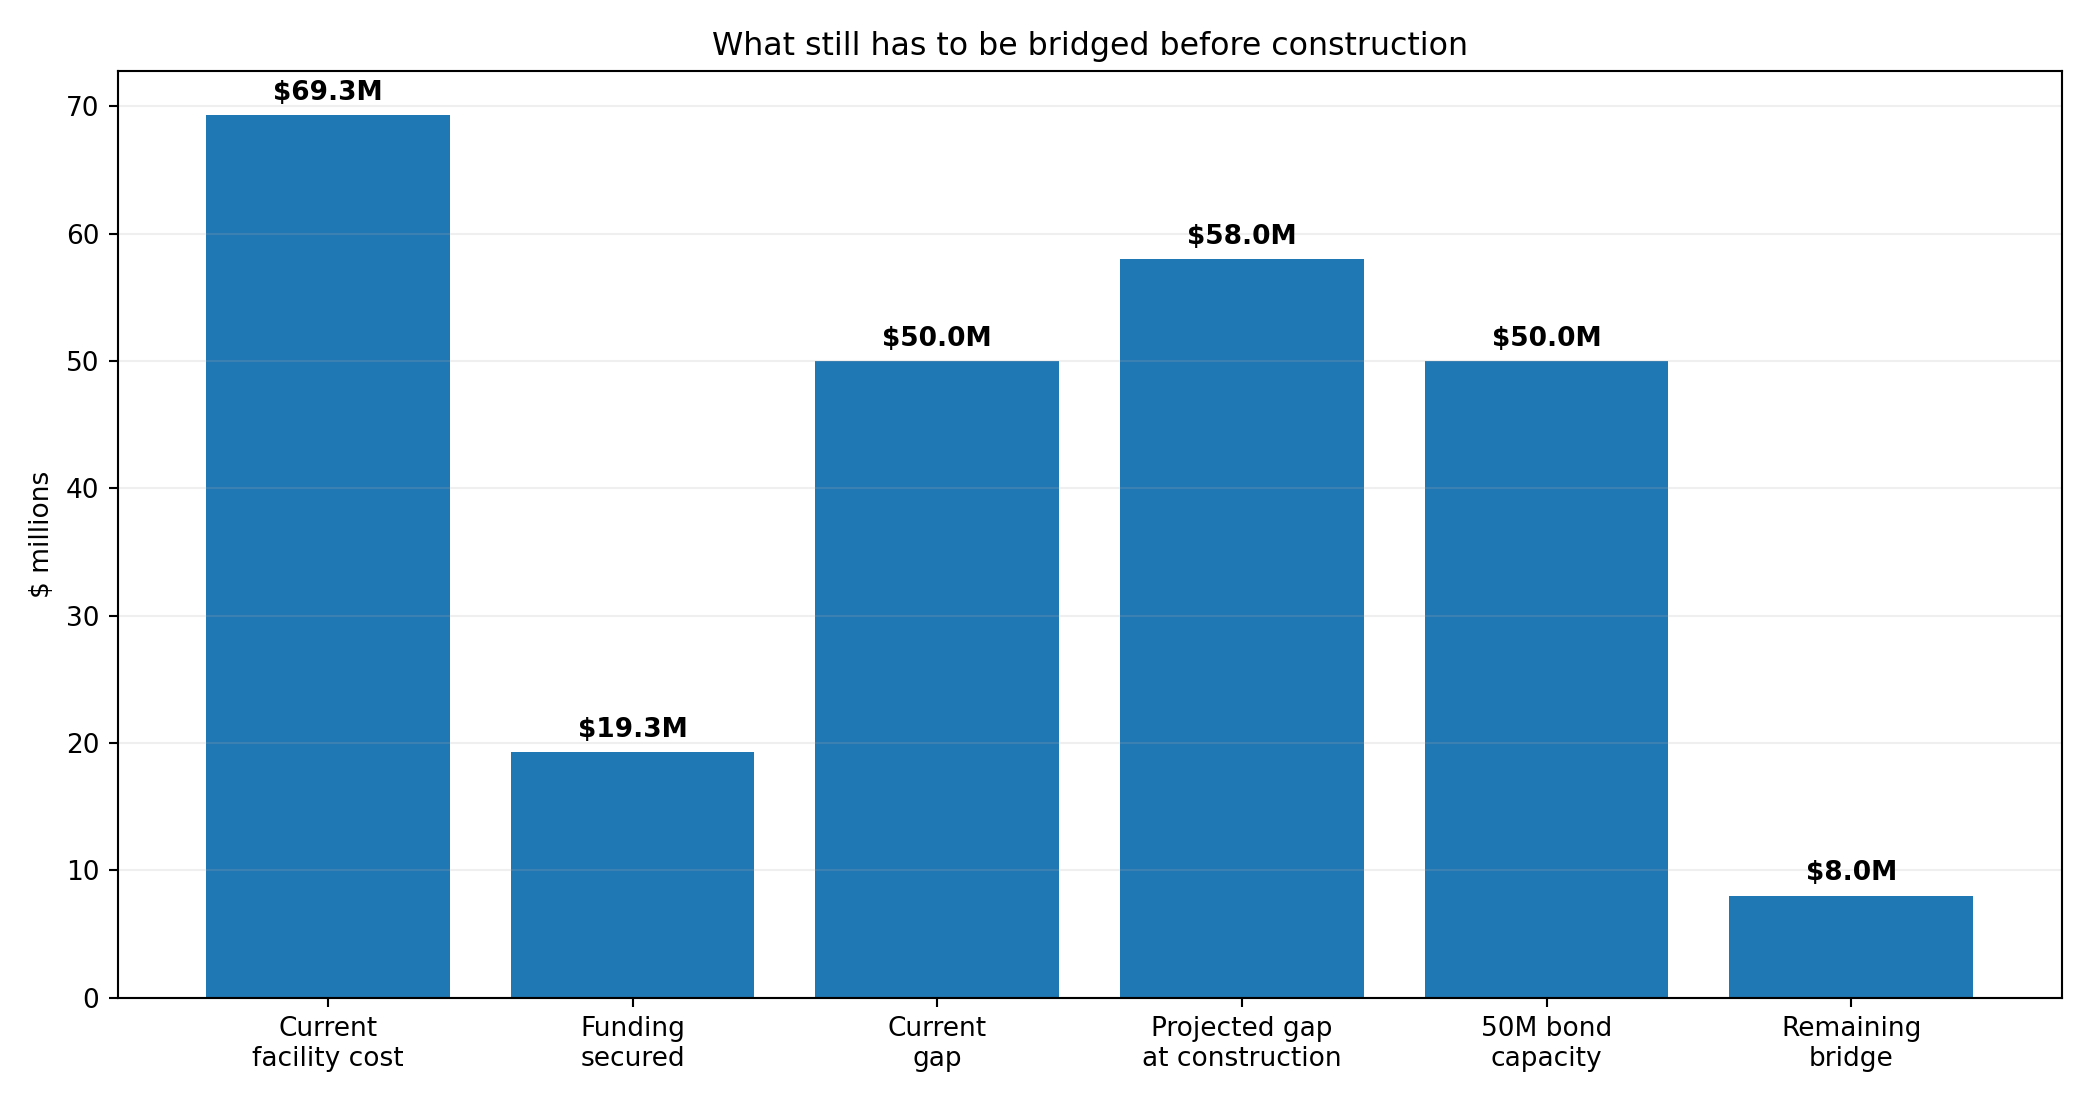
| Current residual gap | ≈$49.98M | Approximately $50M required based on the June 2026 estimate. |
| Estimated construction-time gap | ≈$58M | City's July 2026 estimate after anticipated construction-cost increases and inflation. |
Example 3-year escalation of $50M
| Annual escalation | 3-year result | Increase over $50M |
|---|---|---|
| 5.0% | ≈$57.88M | ≈$7.88M |
| 5.2% | ≈$58.24M | ≈$8.24M |
| 5.5% | ≈$58.73M | ≈$8.73M |
| 6.0% | ≈$59.55M | ≈$9.55M |
What-if illustration only. Actual construction escalation depends on timing, bid conditions, design changes, labor/material costs and procurement.
Why the City also talks about $58 million
The simplest way to read the City's documents is: $69.25M is the total facility program; approximately $19.3M is already identified; approximately $50M is the current residual gap; and approximately $58M is the City's estimated construction-time gap. The $58M figure should not be added to $69.25M or treated as a second $58M project.
Pay as you go: the cost of building one facility at a time
Waiting does not hold today’s price. If Marina had to assemble a replacement revenue stream and build the fire station first, City Hall second, and the police station last, each unbuilt facility would continue to rise in cost while the City saved for it.
Assumptions used
| Input | Value | Why it is used |
|---|---|---|
| Starting identified resources | $19.30M | City’s stated grants, impact fees, reserves, and other identified sources. Restrictions still apply. |
| New annual money available | $3.83M each year | Same scale as the City’s estimated annual Measure Q revenue, but treated here as a hypothetical replacement from delayed programs, other revenue, grants, or a mix. No such City plan is currently adopted. |
| Annual revenue growth | 0% | Keeps the accumulation estimate conservative and easy to follow. |
| Annual construction escalation | 4.0% | Construction-specific planning assumption supported by the benchmarks below. It is not a forecast. |
| Build order | Fire → City Hall → Police | The sequence requested for this scenario. A different order changes which building absorbs the longest delay. |
How the facility baseline is divided: The CFCAC cost table showed $16.0M for Fire, $21.5M for City Hall, and $17.5M for Police, plus up to $6.0M for land acquisition. Applying the City table’s 15% construction adjustment produces $18.40M, $24.725M, and $20.125M. This scenario places the $6.0M land allowance with the first public-safety phase because the site must be secured before the Fire build. The three values total the City’s $69.25M planning baseline. This allocation is a website modeling choice, not a City-approved phasing budget.
What happens to each facility
| Facility | Planning baseline | Funds become sufficient | Cost when built | Increase from waiting | Cumulative construction paid |
|---|---|---|---|---|---|
| Fire station and shared public-safety site | $24.40M | Year 2 | $26.39M | +$1.99M | $26.39M |
| City Hall and Council Chambers | $24.73M | Year 13 | $41.17M | +$16.44M | $67.56M |
| Police station | $20.12M | Year 29 | $62.76M | +$42.64M | $130.32M |
| Total program | $69.25M | Completed in Year 29 | $130.32M | +$61.07M | $130.32M |
Where the 4% escalation assumption comes from
- Marina’s own ENR adjustment: a City staff report documented a 4.17% one-year increase in the ENR index used for Marina’s impact-fee updates.
- ENR’s latest annual readings: ENR reported its Building Cost Index rose 4.2% and its Construction Cost Index rose 3.6% during 2025. The BCI includes skilled construction labor.
- California cross-check: the California Department of General Services builds its California Construction Cost Index from ENR Building Cost Index readings for San Francisco and Los Angeles.
- Regional planning cross-check: San Francisco proposed 4.5% for its 2026 annual infrastructure construction-cost inflation estimate.
City of Marina ENR adjustment report · ENR 1Q 2026 cost report · California DGS CCCI · San Francisco 2026 construction inflation estimate · CFCAC facility-cost tables
The City itself documents the escalation mechanism
This page is no longer based only on a hypothetical what-if table. The City's July 2026 announcement states that the three priority facilities were approximately $69M in the prior estimate, about $19.3M was already identified, leaving roughly $50M, while construction was not expected to begin for about three years and the estimated construction-time need was approximately $58M because of construction-cost increases and inflation.
What the $58 million means
- It is not $58M of new borrowing automatically required today.
- It is a estimated construction-time need.
- The existing ≈$19.3M resources are already part of the funding picture.
- The model must not add inflation twice - once to the total project cost and again to the residual funding gap.
The site therefore shows $50M as the approximate current residual funding requirement and ≈$58M as the City's estimated construction-time gap, while retaining the City's stated ≈$69M total project estimate and ≈$19.3M identified resources as the breakdown.
Escalation does not stop when the first building starts
The City's ≈$58M figure is a estimated construction-time funding gap, not a guarantee that the entire three-building program can still be delivered for $58M regardless of schedule. If design, bidding and construction stretch over many years, the unbuilt portions remain exposed to labor, materials and contractor-cost escalation.
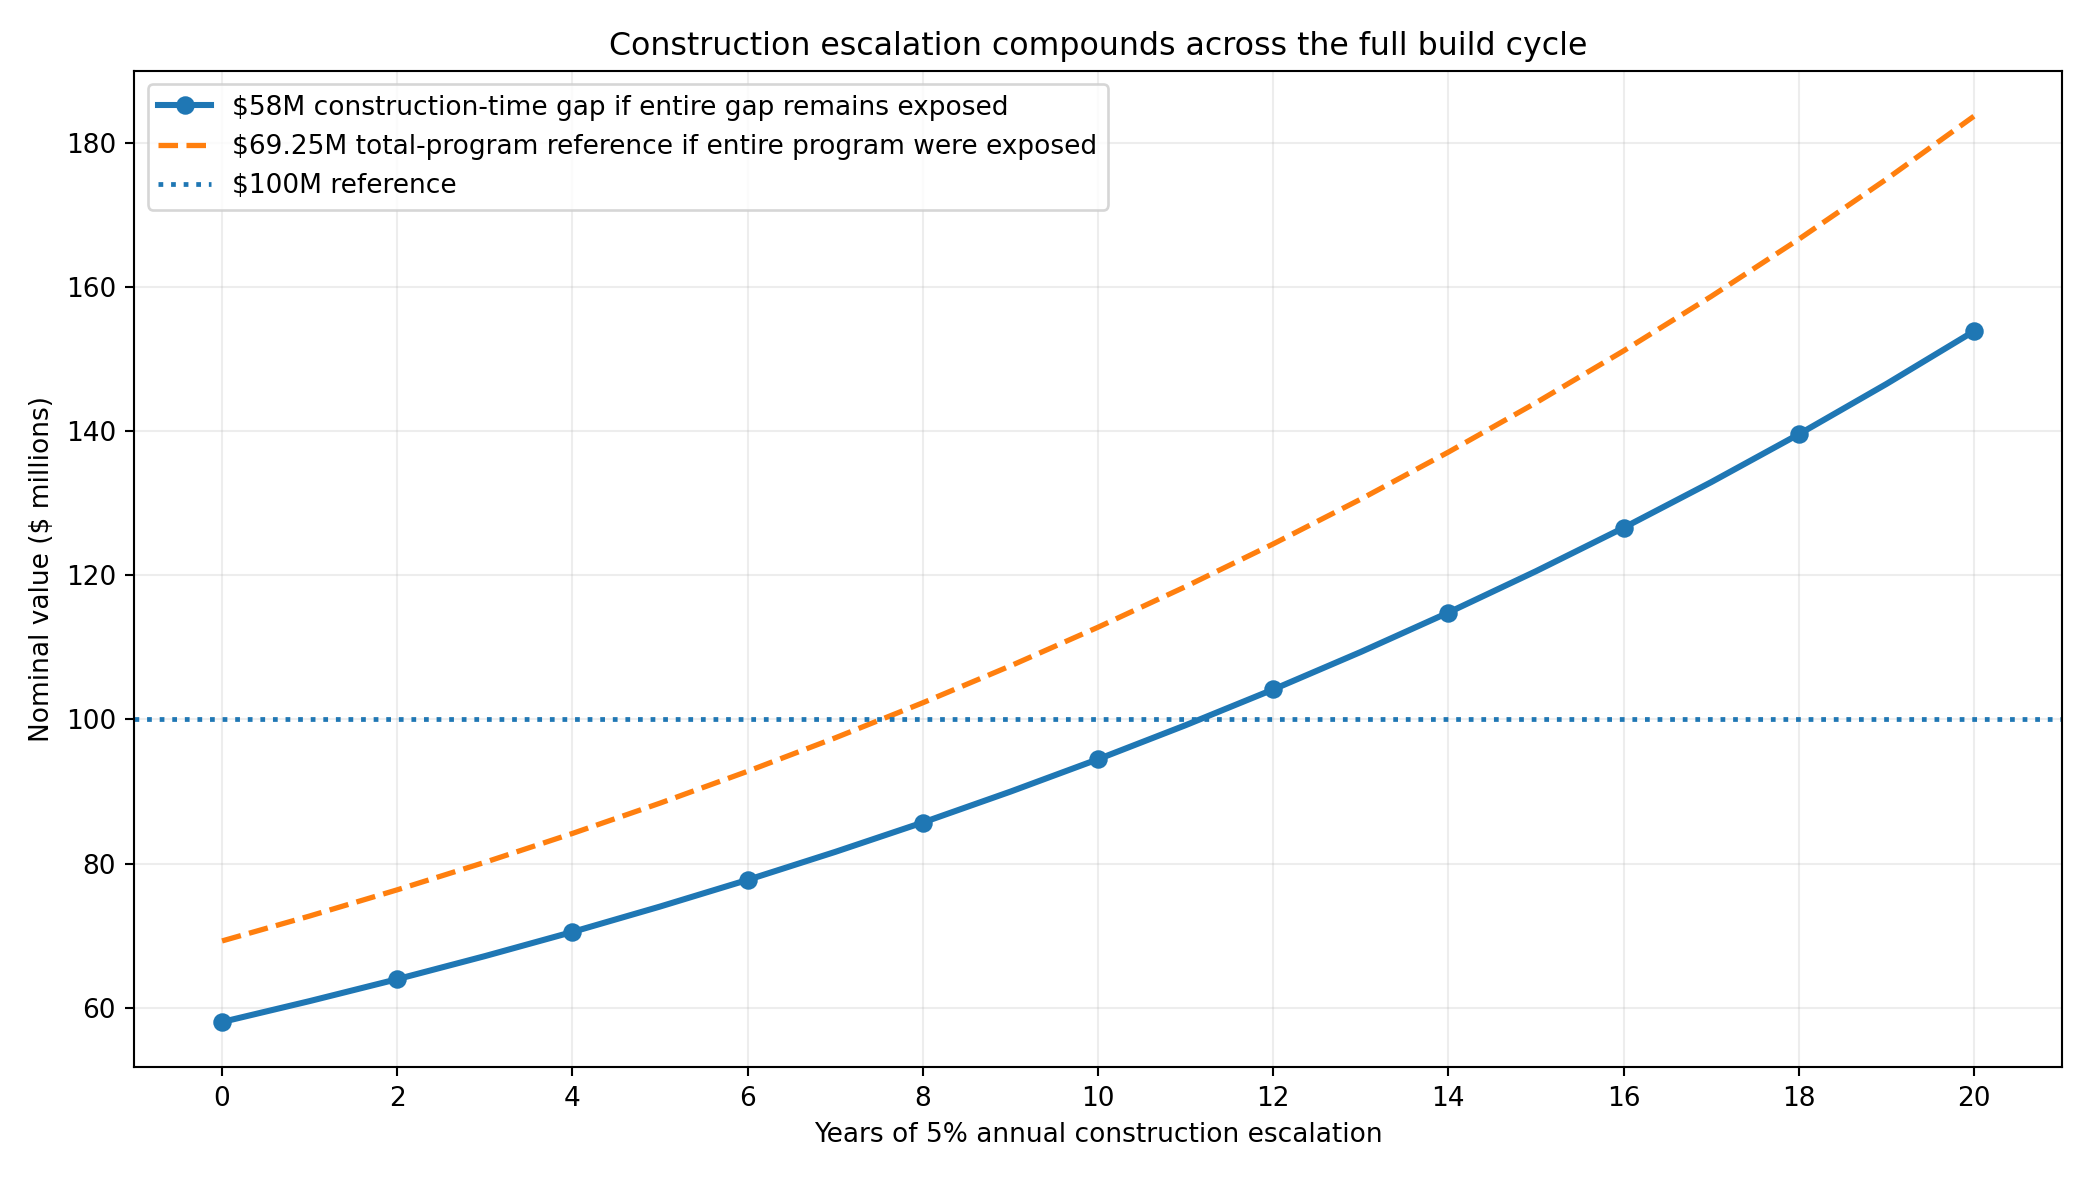
Why assume construction costs will rise?
The escalation analysis is not based on ordinary consumer inflation alone. Marina itself has used the Engineering News-Record (ENR) Construction Cost Index to update development impact fees for construction inflation since 2016. The City's 2022 annual adjustment provides a concrete local example: the ENR index used by Marina rose from 12,647.32 in November 2021 to 13,174.98 in November 2022 - 4.17% in one year.
City of Marina - Development Impact Fees Study Update ↗
City of Marina - 2022 ENR adjustment report (4.17%) ↗
California also maintains its own California Construction Cost Index (CCCI) through the Department of General Services. DGS explains that CCCI is derived from ENR Building Cost Index values for San Francisco and Los Angeles. That makes it a useful California-specific cross-check rather than relying only on a national inflation measure.
California DGS - California Construction Cost Index ↗
Engineering News-Record - Construction Economics and index method ↗
| Evidence / benchmark | What it shows | How this site uses it |
|---|---|---|
| Marina ENR indexing policy | City has indexed development impact fees to ENR construction costs since 2016. | Establishes that construction-specific inflation is already part of Marina's own financial method. |
| Marina Nov. 2021 → Nov. 2022 ENR values | 12,647.32 → 13,174.98, a 4.17% annual increase. | Provides a documented Marina-specific historical comparison to the site's 5% what-if rate. |
| California DGS CCCI | California index based on ENR San Francisco and Los Angeles BCI data. | Provides a California-specific independent construction-cost benchmark. |
| ENR CCI / BCI | Tracks construction labor and material components rather than general consumer prices. | Supports using a construction index when discussing delayed building and improvement projects. |
| City's 2026 facilities estimate | ≈$69M program estimate, ≈$19.3M identified, ≈$50M current gap; City projects ≈$58M needed when construction begins after approximately three years. | The City's own ≈$50M → ≈$58M estimate is displayed separately from this site's long-run 5% what-if model. |
The three facilities in the sequential model
1. Fire Station

First priority in this pay-as-you-go scenario.
2. City Hall / Council Chambers
Second priority in this scenario.
3. Police Station
Third priority in this scenario.
Official photographs are sourced from the City of Marina facilities galleries. See graphics/FACILITY_PHOTO_SOURCES.txt for source pages and the local filenames to use when uploading the final photo files.
Why a $50 million bond and a $58 million future gap are different
The City's July 2026 explanation says the current gap is about $50M, construction is not expected to begin for approximately three years, and the estimated gap at construction is about $58M because of escalation and inflation.
The City's current FAQ says it will continue pursuing grants and external funding and that additional impact fees and other funding sources may be used as available. That is evidence of a continuing funding strategy, but it is not a published commitment to deposit a fixed amount of General Fund money into facility reserves every year.
For scale only, bridging $8M evenly across three years is approximately $2.67M per year. That arithmetic is not the City's adopted annual set-aside plan; no fixed three-year reserve schedule was located in the records reviewed.
City July 9, 2026 explanation of $50M current gap → ≈$58M construction-time gap ↗ · City ballot-measure FAQ on grants, impact fees and $50M money raised-bond capacity ↗
How do other City issues fit?
Parks, Preston Park, development incentives, litigation, recreation facilities and transportation projects can be legitimate questions without necessarily being the same financial question as Measure Q. Use the City Issues & Measure Q FAQ to see what is directly related, indirectly related, or financially separate.