
Three ways to test a $50 million funding plan
These tables use the same $50 million principal and 4.75% fixed interest-rate assumption. What changes is the utility-tax base and whether modeled money raised growth is hypothetically applied to accelerated principal retirement.
Who receives the reduced 3.5% rate?
The final Measure Q information says the reduced rate applies to either: (1) residents enrolled in PG&E's California Alternate Rates for Energy (CARE) program; or (2) qualified seniors age 65 or older who are the head of household and whose household income is at or below 80% of Monterey County Area Median Income (AMI).
For these tables, 34% of residential households are modeled at the reduced 3.5% rate and 66% at the full 7% rate. That 34% is a planning proxy drawn from the City/Keyser Marston scenario that combined CARE households with eligible seniors; it is not a guarantee that exactly 34% will enroll or qualify under the final law. Actual who qualifies will depend on household circumstances and program participation.
Official Measure Q who qualifies definition and taxable services ↗ · City / Keyser Marston June 2026 modeling ↗
What the $300 example means
The $300/month table is a fixed conservative scenario, not a finding that $300 is Marina's average taxable household utility bill. KMA's June 2026 analysis estimates approximately $496/month across all households for the modeled taxable utility categories. The progressive models use the higher documented estimate to show what happens when the starting tax base is closer to KMA's analysis and utility costs change over time.
Accelerated payoff is also a scenario, not a promise. Collections above scheduled debt service could potentially be applied to principal when the final debt terms permit it, but the proposed UUT is a general tax and excess money raised can legally support other general municipal purposes.
Why show three examples?
| Model | Residential starting point | Housing | Utility escalation | Debt treatment |
|---|---|---|---|---|
| 1. City-flat comparison | $300 / household / month | 8,300 fixed | 0% | Conventional 30-year payoff at 4.75% |
| 2. Broad progressive | $496 / household / month | Project-linked growth to buildout | Blanket 8% early / 4% later | Illustration applying all modeled UUT to debt |
| 3. Measure-Q scope refined | $495 / household / month, built from KMA categories | Same project-linked growth | Electric/gas/water 8%→4%; telecom/video 2.5% | Illustration applying all modeled UUT to debt |
If the tax base grows, what UUT rate would be needed?
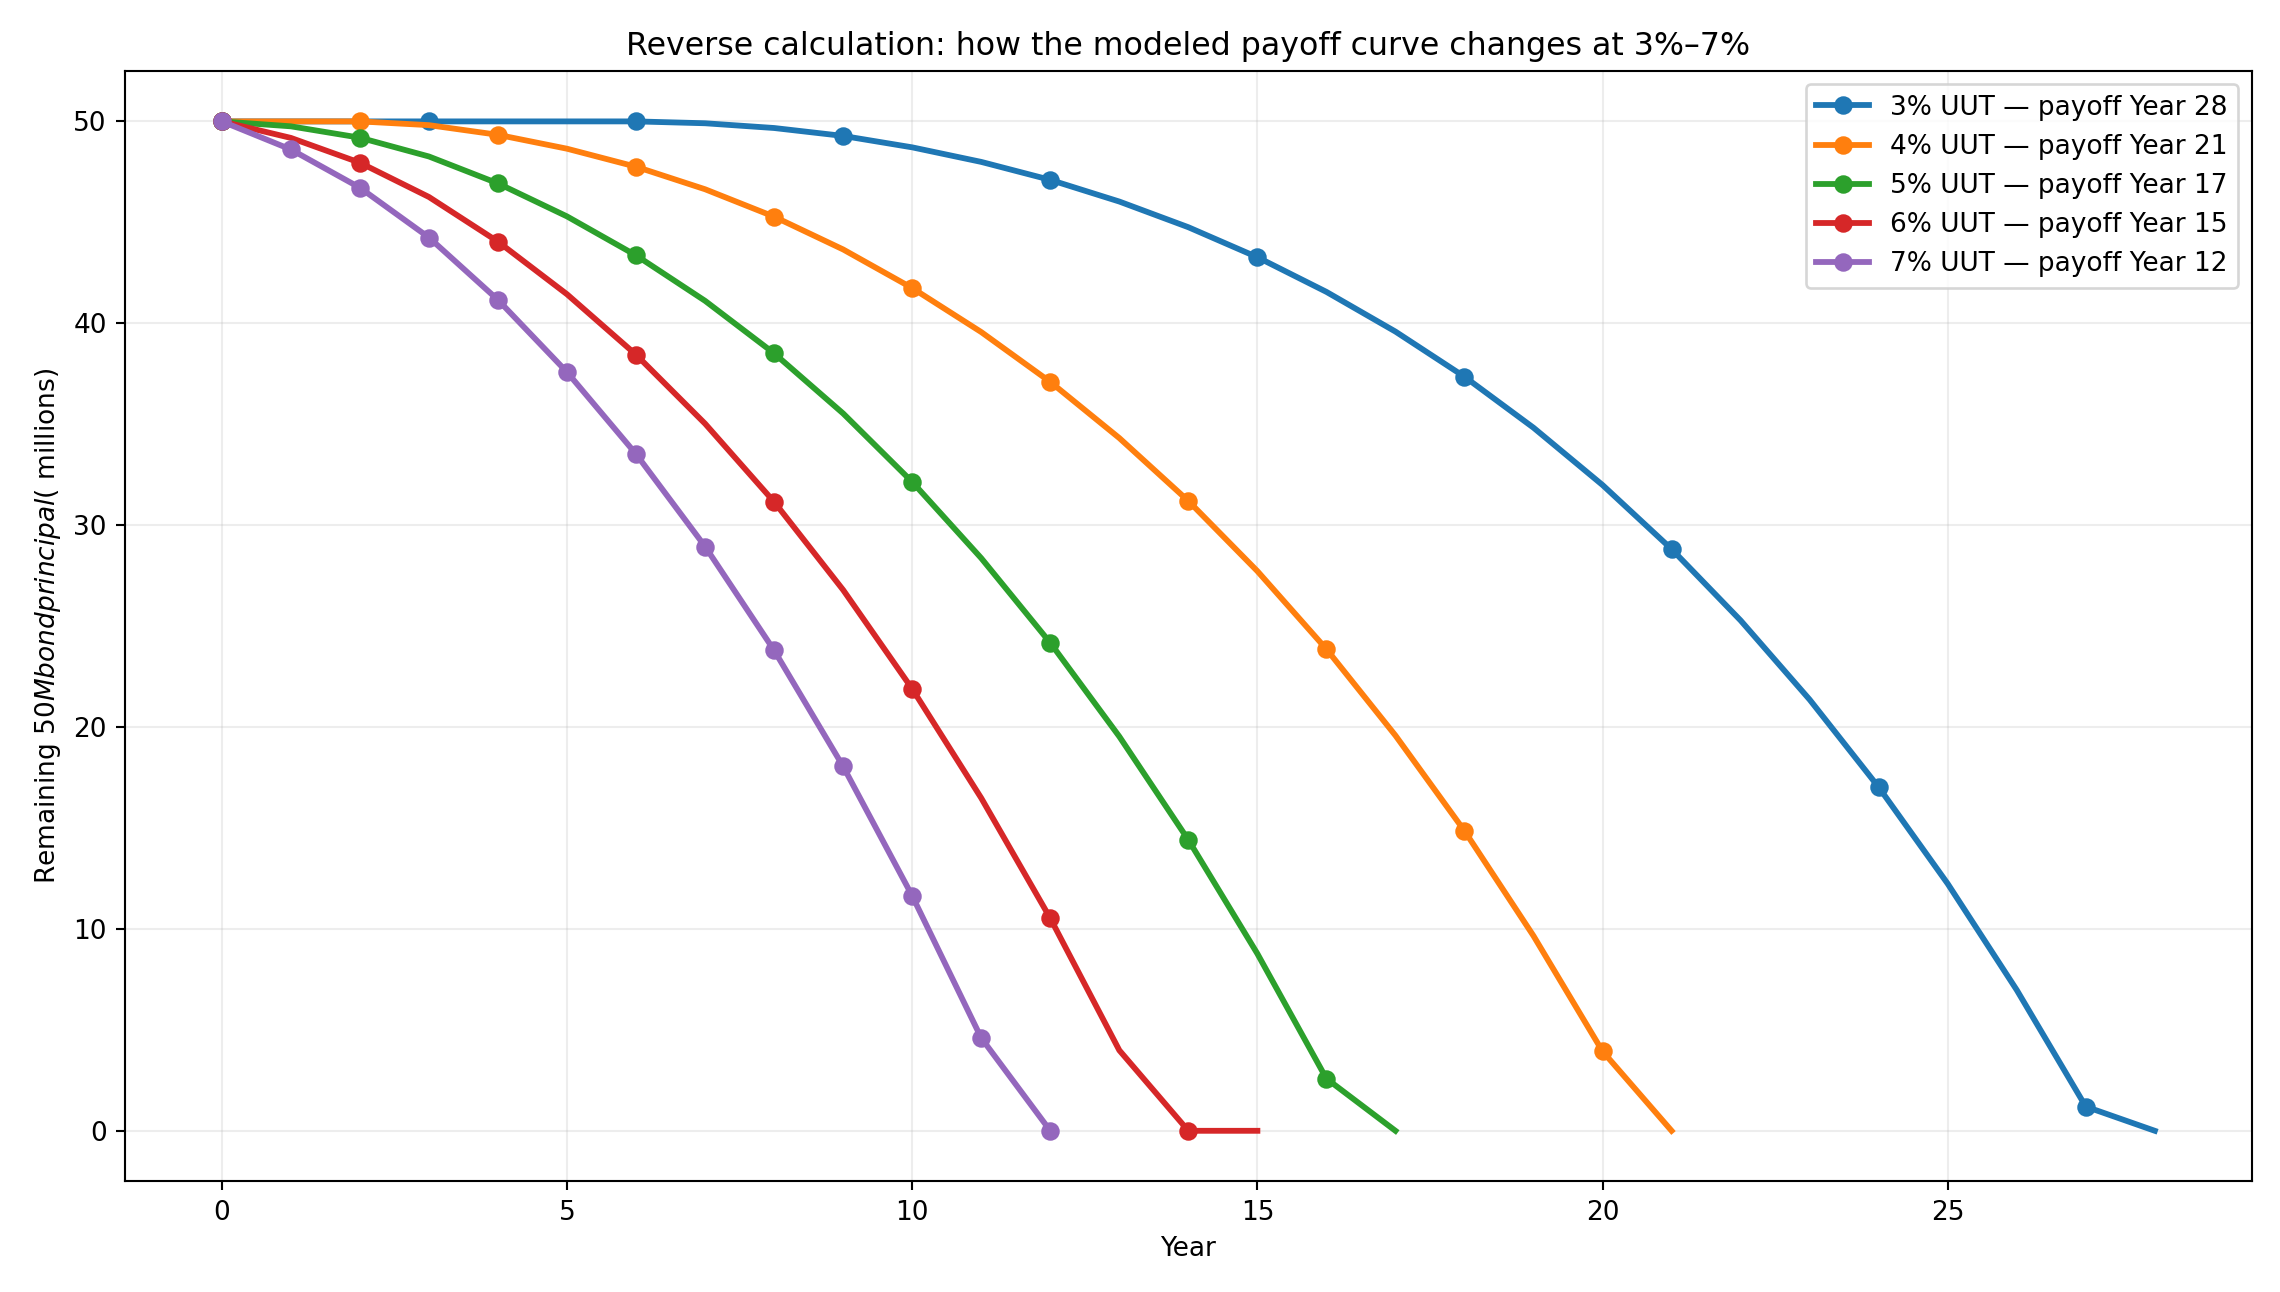
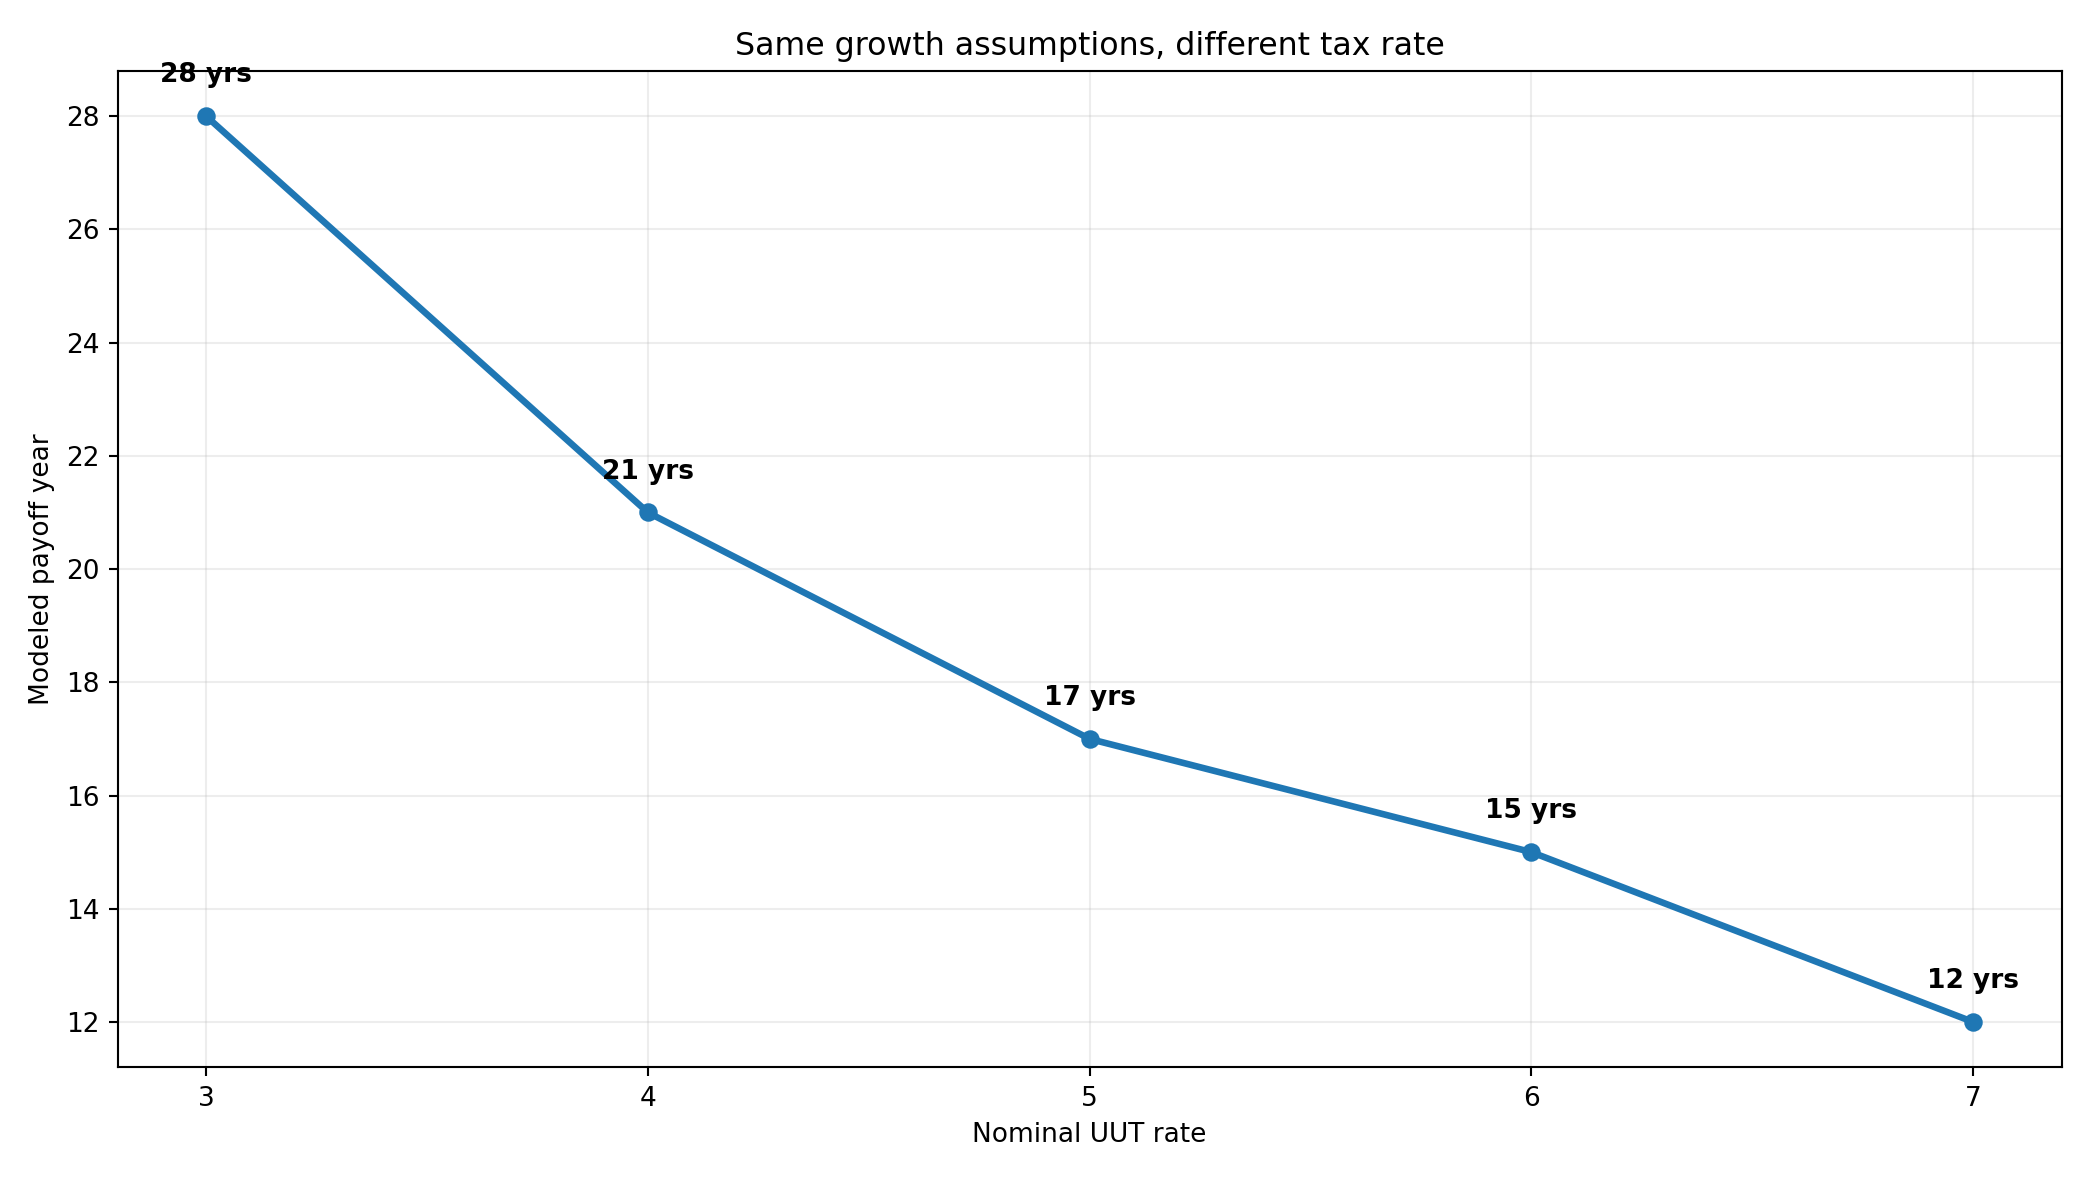
The earlier tables ask, “What happens at the selected 7% rate?” This test asks the question in reverse: if residential buildout and taxable utility costs increase over time, how does the payoff period change when the nominal UUT is reduced?
| Rate | Modeled payoff | Difference from 7% | Interpretation |
|---|---|---|---|
| 7% | Year 12 | ; | Fastest of these scenarios |
| 6% | Year 15 | +3 years | Lower household rate, longer payoff under the same growth assumptions |
| 5% | Year 17 | +5 years | Lower household rate, longer payoff under the same growth assumptions |
| 4% | Year 21 | +9 years | Lower household rate, longer payoff under the same growth assumptions |
| 3% | Year 28 | +16 years | Lower household rate, longer payoff under the same growth assumptions |
The resulting curve is materially different from a static “7% produces about $3M, therefore 7% is needed” presentation. Under this what-if model, 7% retires the debt in about Year 12, 6% in Year 15, 5% in Year 17, 4% in Year 21 and 3% in Year 28.
Visual comparison
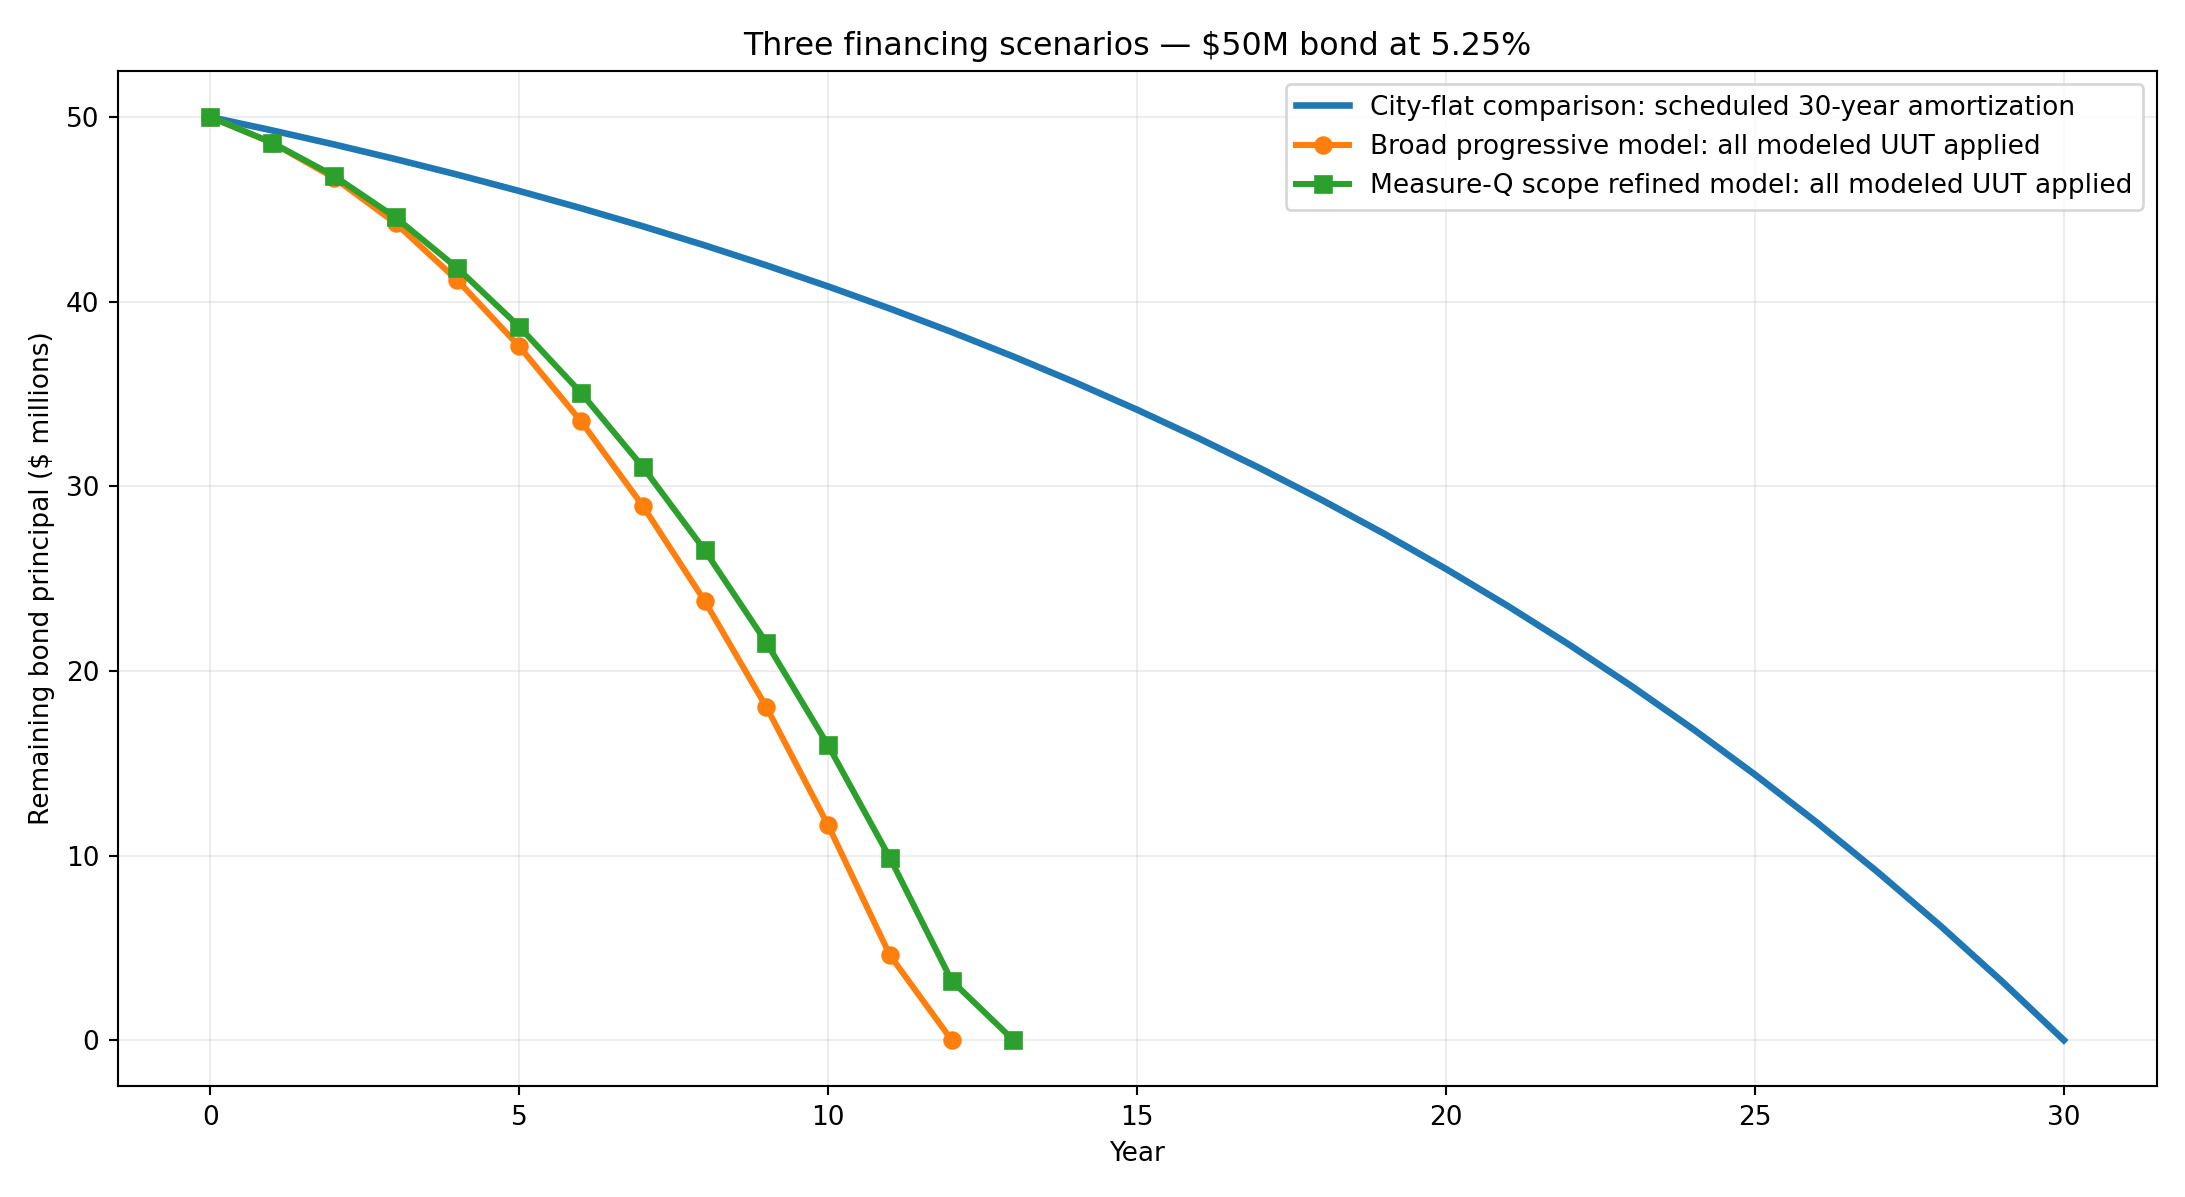
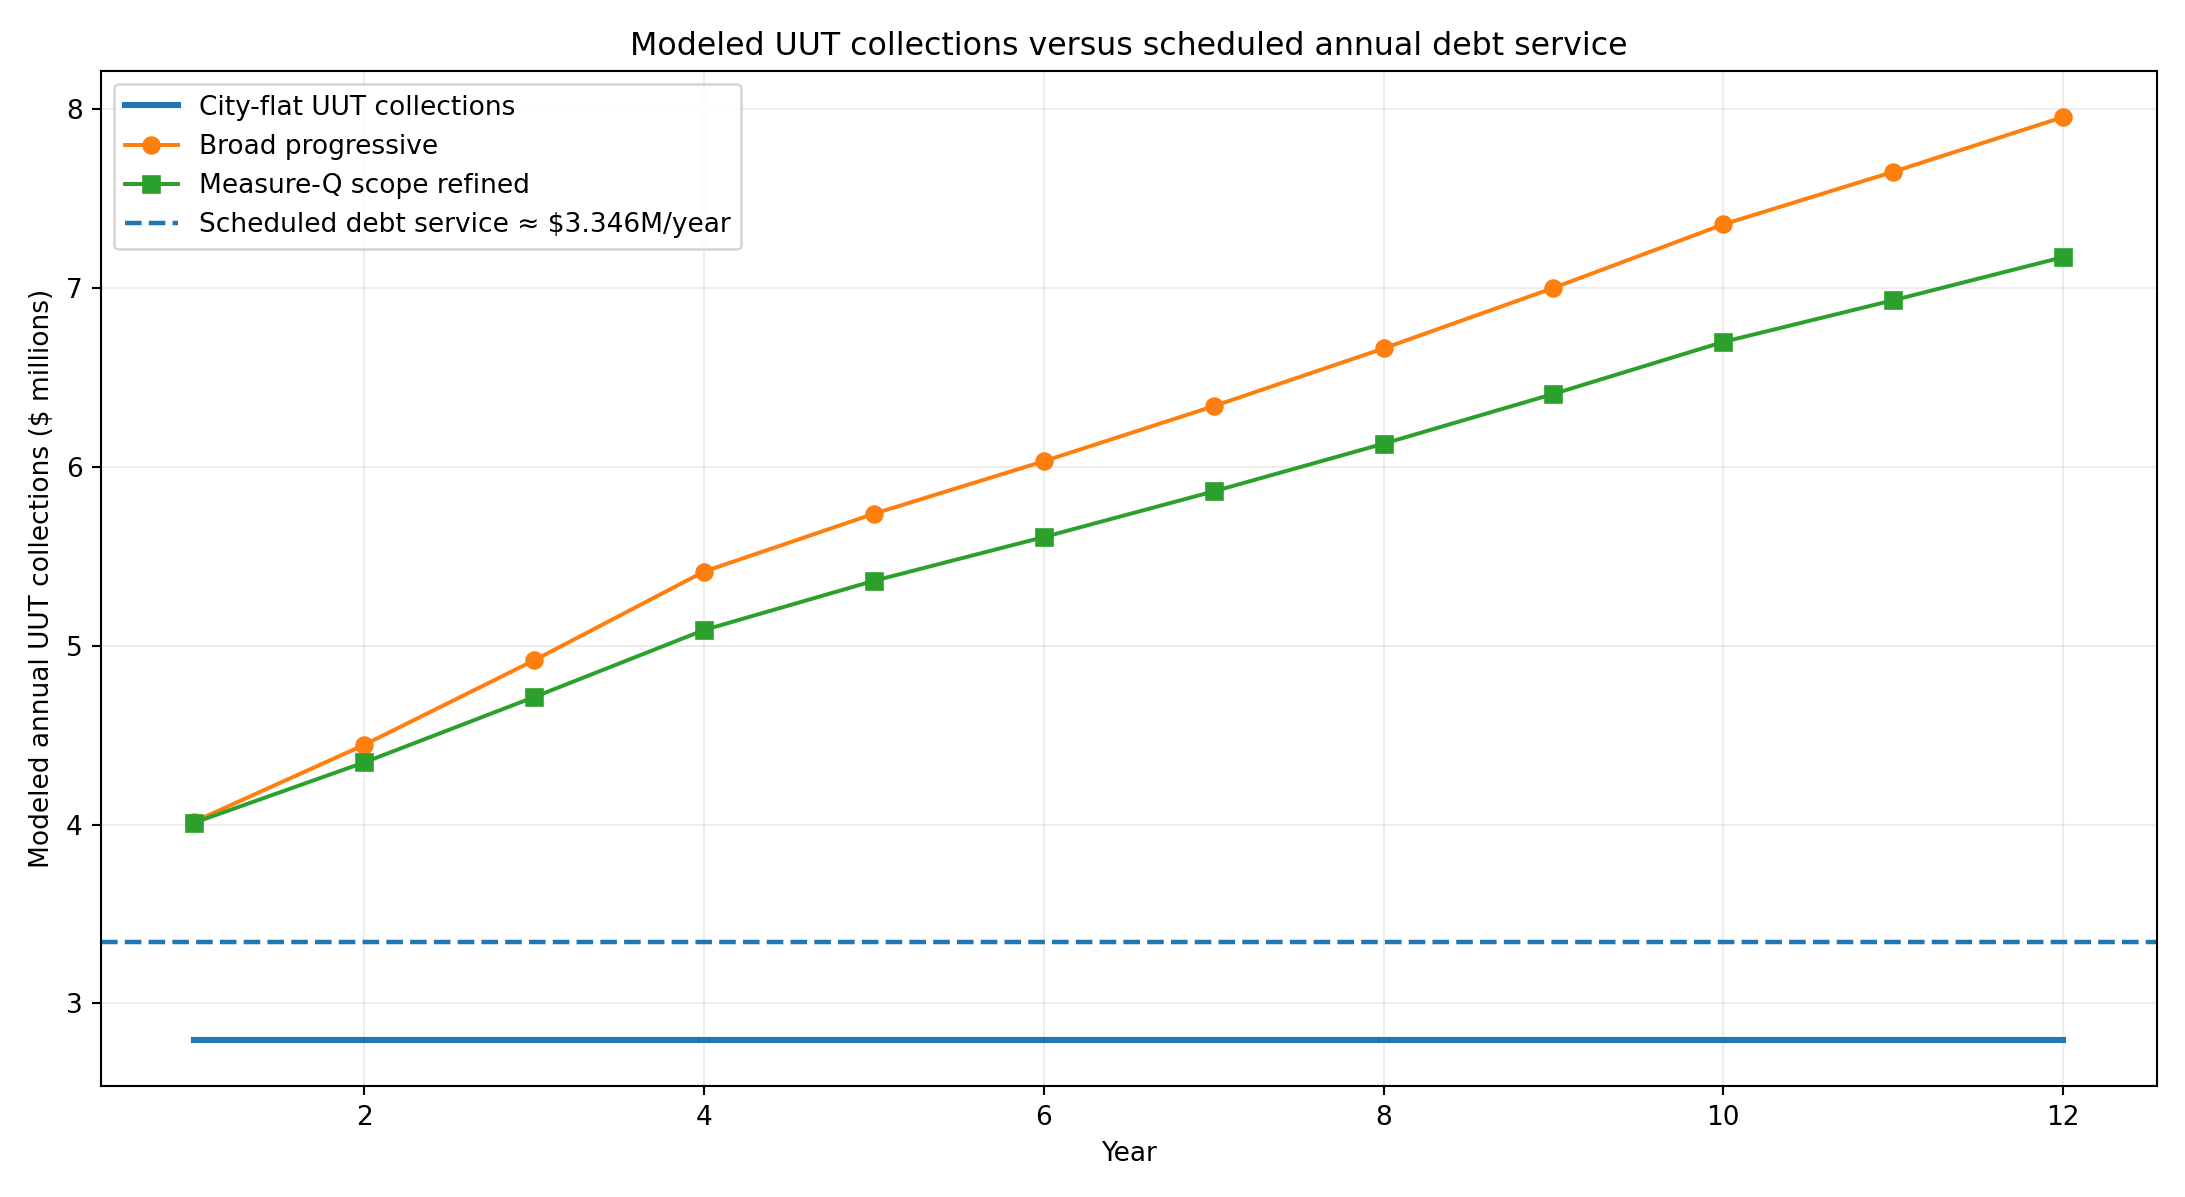
Table 1 - City-flat comparison: full 30-year payoff
Fixed 8,300 residential units, fixed $300/month taxable utility base, 34% reduced-rate households and no utility or housing growth. The 450 commercial-account count and $2,800/month bill are retained only as legacy supplied-model assumptions. KMA's June 2026 analysis instead used an total $13.894 million annual commercial utility base. The interactive calculator uses the KMA total base rather than assuming 450 commercial accounts.
| Year | Residential units | Full-rate households | Reduced-rate households | Commercial accounts* | Taxable res. utility base / household / month | 7% UUT / household / month | 3.5% UUT / eligible household / month | Commercial utility bill / account / month* | Commercial UUT / account / month* | Residential UUT collected / year | Commercial UUT collected / year* | Total modeled UUT / year* | Debt payment applied / year | Interest / year | Principal / year | Remaining bond principal |
|---|---|---|---|---|---|---|---|---|---|---|---|---|---|---|---|---|
| 1 | 8,300 | 5,478 | 2,822 | 450* | $300.00 | $21.00 | $10.50 | $2,800.00* | $196.00* | $1,736,028 | $1,058,400* | $2,794,428* | $3,345,847 | $2,625,000 | $720,847 | $49,279,153 |
| 2 | 8,300 | 5,478 | 2,822 | 450* | $300.00 | $21.00 | $10.50 | $2,800.00* | $196.00* | $1,736,028 | $1,058,400* | $2,794,428* | $3,345,847 | $2,587,156 | $758,691 | $48,520,462 |
| 3 | 8,300 | 5,478 | 2,822 | 450* | $300.00 | $21.00 | $10.50 | $2,800.00* | $196.00* | $1,736,028 | $1,058,400* | $2,794,428* | $3,345,847 | $2,547,324 | $798,522 | $47,721,940 |
| 4 | 8,300 | 5,478 | 2,822 | 450* | $300.00 | $21.00 | $10.50 | $2,800.00* | $196.00* | $1,736,028 | $1,058,400* | $2,794,428* | $3,345,847 | $2,505,402 | $840,445 | $46,881,495 |
| 5 | 8,300 | 5,478 | 2,822 | 450* | $300.00 | $21.00 | $10.50 | $2,800.00* | $196.00* | $1,736,028 | $1,058,400* | $2,794,428* | $3,345,847 | $2,461,278 | $884,568 | $45,996,927 |
| 6 | 8,300 | 5,478 | 2,822 | 450* | $300.00 | $21.00 | $10.50 | $2,800.00* | $196.00* | $1,736,028 | $1,058,400* | $2,794,428* | $3,345,847 | $2,414,839 | $931,008 | $45,065,919 |
| 7 | 8,300 | 5,478 | 2,822 | 450* | $300.00 | $21.00 | $10.50 | $2,800.00* | $196.00* | $1,736,028 | $1,058,400* | $2,794,428* | $3,345,847 | $2,365,961 | $979,886 | $44,086,033 |
| 8 | 8,300 | 5,478 | 2,822 | 450* | $300.00 | $21.00 | $10.50 | $2,800.00* | $196.00* | $1,736,028 | $1,058,400* | $2,794,428* | $3,345,847 | $2,314,517 | $1,031,330 | $43,054,703 |
| 9 | 8,300 | 5,478 | 2,822 | 450* | $300.00 | $21.00 | $10.50 | $2,800.00* | $196.00* | $1,736,028 | $1,058,400* | $2,794,428* | $3,345,847 | $2,260,372 | $1,085,475 | $41,969,228 |
| 10 | 8,300 | 5,478 | 2,822 | 450* | $300.00 | $21.00 | $10.50 | $2,800.00* | $196.00* | $1,736,028 | $1,058,400* | $2,794,428* | $3,345,847 | $2,203,384 | $1,142,462 | $40,826,766 |
| 11 | 8,300 | 5,478 | 2,822 | 450* | $300.00 | $21.00 | $10.50 | $2,800.00* | $196.00* | $1,736,028 | $1,058,400* | $2,794,428* | $3,345,847 | $2,143,405 | $1,202,441 | $39,624,324 |
| 12 | 8,300 | 5,478 | 2,822 | 450* | $300.00 | $21.00 | $10.50 | $2,800.00* | $196.00* | $1,736,028 | $1,058,400* | $2,794,428* | $3,345,847 | $2,080,277 | $1,265,570 | $38,358,755 |
| 13 | 8,300 | 5,478 | 2,822 | 450* | $300.00 | $21.00 | $10.50 | $2,800.00* | $196.00* | $1,736,028 | $1,058,400* | $2,794,428* | $3,345,847 | $2,013,835 | $1,332,012 | $37,026,743 |
| 14 | 8,300 | 5,478 | 2,822 | 450* | $300.00 | $21.00 | $10.50 | $2,800.00* | $196.00* | $1,736,028 | $1,058,400* | $2,794,428* | $3,345,847 | $1,943,904 | $1,401,943 | $35,624,800 |
| 15 | 8,300 | 5,478 | 2,822 | 450* | $300.00 | $21.00 | $10.50 | $2,800.00* | $196.00* | $1,736,028 | $1,058,400* | $2,794,428* | $3,345,847 | $1,870,302 | $1,475,545 | $34,149,255 |
| 16 | 8,300 | 5,478 | 2,822 | 450* | $300.00 | $21.00 | $10.50 | $2,800.00* | $196.00* | $1,736,028 | $1,058,400* | $2,794,428* | $3,345,847 | $1,792,836 | $1,553,011 | $32,596,245 |
| 17 | 8,300 | 5,478 | 2,822 | 450* | $300.00 | $21.00 | $10.50 | $2,800.00* | $196.00* | $1,736,028 | $1,058,400* | $2,794,428* | $3,345,847 | $1,711,303 | $1,634,544 | $30,961,701 |
| 18 | 8,300 | 5,478 | 2,822 | 450* | $300.00 | $21.00 | $10.50 | $2,800.00* | $196.00* | $1,736,028 | $1,058,400* | $2,794,428* | $3,345,847 | $1,625,489 | $1,720,357 | $29,241,343 |
| 19 | 8,300 | 5,478 | 2,822 | 450* | $300.00 | $21.00 | $10.50 | $2,800.00* | $196.00* | $1,736,028 | $1,058,400* | $2,794,428* | $3,345,847 | $1,535,171 | $1,810,676 | $27,430,667 |
| 20 | 8,300 | 5,478 | 2,822 | 450* | $300.00 | $21.00 | $10.50 | $2,800.00* | $196.00* | $1,736,028 | $1,058,400* | $2,794,428* | $3,345,847 | $1,440,110 | $1,905,737 | $25,524,931 |
| 21 | 8,300 | 5,478 | 2,822 | 450* | $300.00 | $21.00 | $10.50 | $2,800.00* | $196.00* | $1,736,028 | $1,058,400* | $2,794,428* | $3,345,847 | $1,340,059 | $2,005,788 | $23,519,143 |
| 22 | 8,300 | 5,478 | 2,822 | 450* | $300.00 | $21.00 | $10.50 | $2,800.00* | $196.00* | $1,736,028 | $1,058,400* | $2,794,428* | $3,345,847 | $1,234,755 | $2,111,092 | $21,408,051 |
| 23 | 8,300 | 5,478 | 2,822 | 450* | $300.00 | $21.00 | $10.50 | $2,800.00* | $196.00* | $1,736,028 | $1,058,400* | $2,794,428* | $3,345,847 | $1,123,923 | $2,221,924 | $19,186,127 |
| 24 | 8,300 | 5,478 | 2,822 | 450* | $300.00 | $21.00 | $10.50 | $2,800.00* | $196.00* | $1,736,028 | $1,058,400* | $2,794,428* | $3,345,847 | $1,007,272 | $2,338,575 | $16,847,552 |
| 25 | 8,300 | 5,478 | 2,822 | 450* | $300.00 | $21.00 | $10.50 | $2,800.00* | $196.00* | $1,736,028 | $1,058,400* | $2,794,428* | $3,345,847 | $884,496 | $2,461,350 | $14,386,202 |
| 26 | 8,300 | 5,478 | 2,822 | 450* | $300.00 | $21.00 | $10.50 | $2,800.00* | $196.00* | $1,736,028 | $1,058,400* | $2,794,428* | $3,345,847 | $755,276 | $2,590,571 | $11,795,631 |
| 27 | 8,300 | 5,478 | 2,822 | 450* | $300.00 | $21.00 | $10.50 | $2,800.00* | $196.00* | $1,736,028 | $1,058,400* | $2,794,428* | $3,345,847 | $619,271 | $2,726,576 | $9,069,055 |
| 28 | 8,300 | 5,478 | 2,822 | 450* | $300.00 | $21.00 | $10.50 | $2,800.00* | $196.00* | $1,736,028 | $1,058,400* | $2,794,428* | $3,345,847 | $476,125 | $2,869,721 | $6,199,333 |
| 29 | 8,300 | 5,478 | 2,822 | 450* | $300.00 | $21.00 | $10.50 | $2,800.00* | $196.00* | $1,736,028 | $1,058,400* | $2,794,428* | $3,345,847 | $325,465 | $3,020,382 | $3,178,952 |
| 30 | 8,300 | 5,478 | 2,822 | 450* | $300.00 | $21.00 | $10.50 | $2,800.00* | $196.00* | $1,736,028 | $1,058,400* | $2,794,428* | $3,345,847 | $166,895 | $3,178,952 | $0 |
Table 2 - Broad progressive model
Starts at the broader $496 monthly household utility figure used in the earlier model, grows housing only through the documented development buildout schedule, and applies the earlier blanket utility-escalation assumptions. All modeled UUT collections are hypothetically applied to the bond.
| Year | Residential units | Full-rate households | Reduced-rate households | Commercial accounts* | Taxable res. utility base / household / month | 7% UUT / household / month | 3.5% UUT / eligible household / month | Commercial utility bill / account / month* | Commercial UUT / account / month* | Residential UUT collected / year | Commercial UUT collected / year* | Total modeled UUT / year* | Debt payment applied / year | Interest / year | Principal / year | Remaining bond principal |
|---|---|---|---|---|---|---|---|---|---|---|---|---|---|---|---|---|
| 1 | 8,554 | 5,646 | 2,908 | 450* | $496.00 | $34.72 | $17.36 | $2,800.00* | $196.00* | $2,958,144 | $1,058,400* | $4,016,544* | $4,016,544 | $2,625,000 | $1,391,544 | $48,608,456 |
| 2 | 8,844 | 5,837 | 3,007 | 450* | $535.68 | $37.50 | $18.75 | $3,024.00* | $211.68* | $3,303,014 | $1,143,072* | $4,446,086* | $4,446,086 | $2,551,944 | $1,894,142 | $46,714,314 |
| 3 | 9,133 | 6,028 | 3,105 | 450* | $578.53 | $40.50 | $20.25 | $3,265.92* | $228.61* | $3,683,887 | $1,234,518* | $4,918,405* | $4,918,405 | $2,452,502 | $2,465,903 | $44,248,411 |
| 4 | 9,369 | 6,184 | 3,185 | 450* | $624.82 | $43.74 | $21.87 | $3,527.19* | $246.90* | $4,081,468 | $1,333,279* | $5,414,747* | $5,414,747 | $2,323,042 | $3,091,706 | $41,156,705 |
| 5 | 9,605 | 6,339 | 3,266 | 450* | $649.81 | $45.49 | $22.74 | $3,668.28* | $256.78* | $4,351,439 | $1,386,610* | $5,738,049* | $5,738,049 | $2,160,727 | $3,577,322 | $37,579,383 |
| 6 | 9,741 | 6,429 | 3,312 | 450* | $675.80 | $47.31 | $23.65 | $3,815.01* | $267.05* | $4,589,643 | $1,442,075* | $6,031,718* | $6,031,718 | $1,972,918 | $4,058,800 | $33,520,583 |
| 7 | 9,877 | 6,519 | 3,358 | 450* | $702.83 | $49.20 | $24.60 | $3,967.61* | $277.73* | $4,839,942 | $1,499,758* | $6,339,700* | $6,339,700 | $1,759,831 | $4,579,869 | $28,940,714 |
| 8 | 10,013 | 6,609 | 3,404 | 450* | $730.95 | $51.17 | $25.58 | $4,126.32* | $288.84* | $5,102,921 | $1,559,748* | $6,662,669* | $6,662,669 | $1,519,387 | $5,143,282 | $23,797,432 |
| 9 | 10,149 | 6,698 | 3,451 | 450* | $760.19 | $53.21 | $26.61 | $4,291.37* | $300.40* | $5,378,876 | $1,622,138* | $7,001,014* | $7,001,014 | $1,249,365 | $5,751,648 | $18,045,783 |
| 10 | 10,285 | 6,788 | 3,497 | 450* | $790.59 | $55.34 | $27.67 | $4,463.03* | $312.41* | $5,669,074 | $1,687,024* | $7,356,097* | $7,356,097 | $947,404 | $6,408,694 | $11,637,090 |
| 11 | 10,285 | 6,788 | 3,497 | 450* | $822.22 | $57.56 | $28.78 | $4,641.55* | $324.91* | $5,895,837 | $1,754,504* | $7,650,341* | $7,650,341 | $610,947 | $7,039,394 | $4,597,696 |
| 12 | 10,285 | 6,788 | 3,497 | 450* | $855.11 | $59.86 | $29.93 | $4,827.21* | $337.90* | $6,131,670 | $1,824,685* | $7,956,355* | $4,839,075 | $241,379 | $4,597,696 | $0 |
Modeled payoff: Year 12 under the stated assumptions.
Table 3 - Current Measure-Q scope refined by utility category
This table rebuilds the starting household base from the KMA monthly categories that the current Measure Q page identifies as taxable: electric $143 + gas $69 + water $82 + telecommunications $110 + video $91 = $495/month. Instead of escalating the entire bill at one rate, electric/gas/water follow the higher supplied utility-rate path while telecommunications/video use 2.5% annual growth.
| Year | Residential units | Full-rate households | Reduced-rate households | Commercial accounts* | Taxable res. utility base / household / month | 7% UUT / household / month | 3.5% UUT / eligible household / month | Commercial utility bill / account / month* | Commercial UUT / account / month* | Residential UUT collected / year | Commercial UUT collected / year* | Total modeled UUT / year* | Debt payment applied / year | Interest / year | Principal / year | Remaining bond principal |
|---|---|---|---|---|---|---|---|---|---|---|---|---|---|---|---|---|
| 1 | 8,554 | 5,646 | 2,908 | 450* | $495.00 | $34.65 | $17.33 | $2,800.00* | $196.00* | $2,952,180 | $1,058,400* | $4,010,580* | $4,010,580 | $2,625,000 | $1,385,580 | $48,614,420 |
| 2 | 8,844 | 5,837 | 3,007 | 450* | $523.54 | $36.65 | $18.32 | $2,961.47* | $207.30* | $3,228,189 | $1,119,434* | $4,347,623* | $4,347,623 | $2,552,257 | $1,795,366 | $46,819,054 |
| 3 | 9,133 | 6,028 | 3,105 | 450* | $554.10 | $38.79 | $19.39 | $3,134.29* | $219.40* | $3,528,281 | $1,184,761* | $4,713,041* | $4,713,041 | $2,458,000 | $2,255,041 | $44,564,013 |
| 4 | 9,369 | 6,184 | 3,185 | 450* | $586.81 | $41.08 | $20.54 | $3,319.33* | $232.35* | $3,833,198 | $1,254,707* | $5,087,905* | $5,087,905 | $2,339,611 | $2,748,294 | $41,815,719 |
| 5 | 9,605 | 6,339 | 3,266 | 450* | $607.04 | $42.49 | $21.25 | $3,433.74* | $240.36* | $4,065,004 | $1,297,953* | $5,362,957* | $5,362,957 | $2,195,325 | $3,167,632 | $38,648,087 |
| 6 | 9,741 | 6,429 | 3,312 | 450* | $627.99 | $43.96 | $21.98 | $3,552.26* | $248.66* | $4,264,927 | $1,342,755* | $5,607,682* | $5,607,682 | $2,029,025 | $3,578,658 | $35,069,429 |
| 7 | 9,877 | 6,519 | 3,358 | 450* | $649.70 | $45.48 | $22.74 | $3,675.06* | $257.25* | $4,474,027 | $1,389,172* | $5,863,199* | $5,863,199 | $1,841,145 | $4,022,054 | $31,047,375 |
| 8 | 10,013 | 6,609 | 3,404 | 450* | $672.19 | $47.05 | $23.53 | $3,802.28* | $266.16* | $4,692,714 | $1,437,263* | $6,129,977* | $6,129,977 | $1,629,987 | $4,499,990 | $26,547,386 |
| 9 | 10,149 | 6,698 | 3,451 | 450* | $695.49 | $48.68 | $24.34 | $3,934.10* | $275.39* | $4,921,127 | $1,487,090* | $6,408,217* | $6,408,217 | $1,393,738 | $5,014,479 | $21,532,906 |
| 10 | 10,285 | 6,788 | 3,497 | 450* | $719.64 | $50.37 | $25.19 | $4,070.69* | $284.95* | $5,160,287 | $1,538,719* | $6,699,007* | $6,699,007 | $1,130,478 | $5,568,529 | $15,964,378 |
| 11 | 10,285 | 6,788 | 3,497 | 450* | $744.66 | $52.13 | $26.06 | $4,212.21* | $294.86* | $5,339,699 | $1,592,217* | $6,931,916* | $6,931,916 | $838,130 | $6,093,786 | $9,870,591 |
| 12 | 10,285 | 6,788 | 3,497 | 450* | $770.59 | $53.94 | $26.97 | $4,358.87* | $305.12* | $5,525,612 | $1,647,654* | $7,173,266* | $7,173,266 | $518,206 | $6,655,060 | $3,215,532 |
| 13 | 10,285 | 6,788 | 3,497 | 450* | $801.41 | $56.10 | $28.05 | $4,533.23* | $317.33* | $5,746,637 | $1,713,560* | $7,460,196* | $3,384,347 | $168,815 | $3,215,532 | $0 |
Modeled payoff: Year 13 under the stated assumptions.
What these payoff tables cannot tell us
Measure Q is a General Fund tax and the ballot language says it continues until ended by voters; the City Council also has authority under the measure framework to reduce or suspend it. A growing UUT does not automatically force surplus collections into early bond principal. Actual bond documents, call provisions, reserve requirements and future Council actions would determine whether and how early retirement occurs.
How the tax rate can change the payoff time
A lower nominal UUT lowers the household percentage but extends the modeled payoff period. The second axis shows the progressive taxable utility base over time.
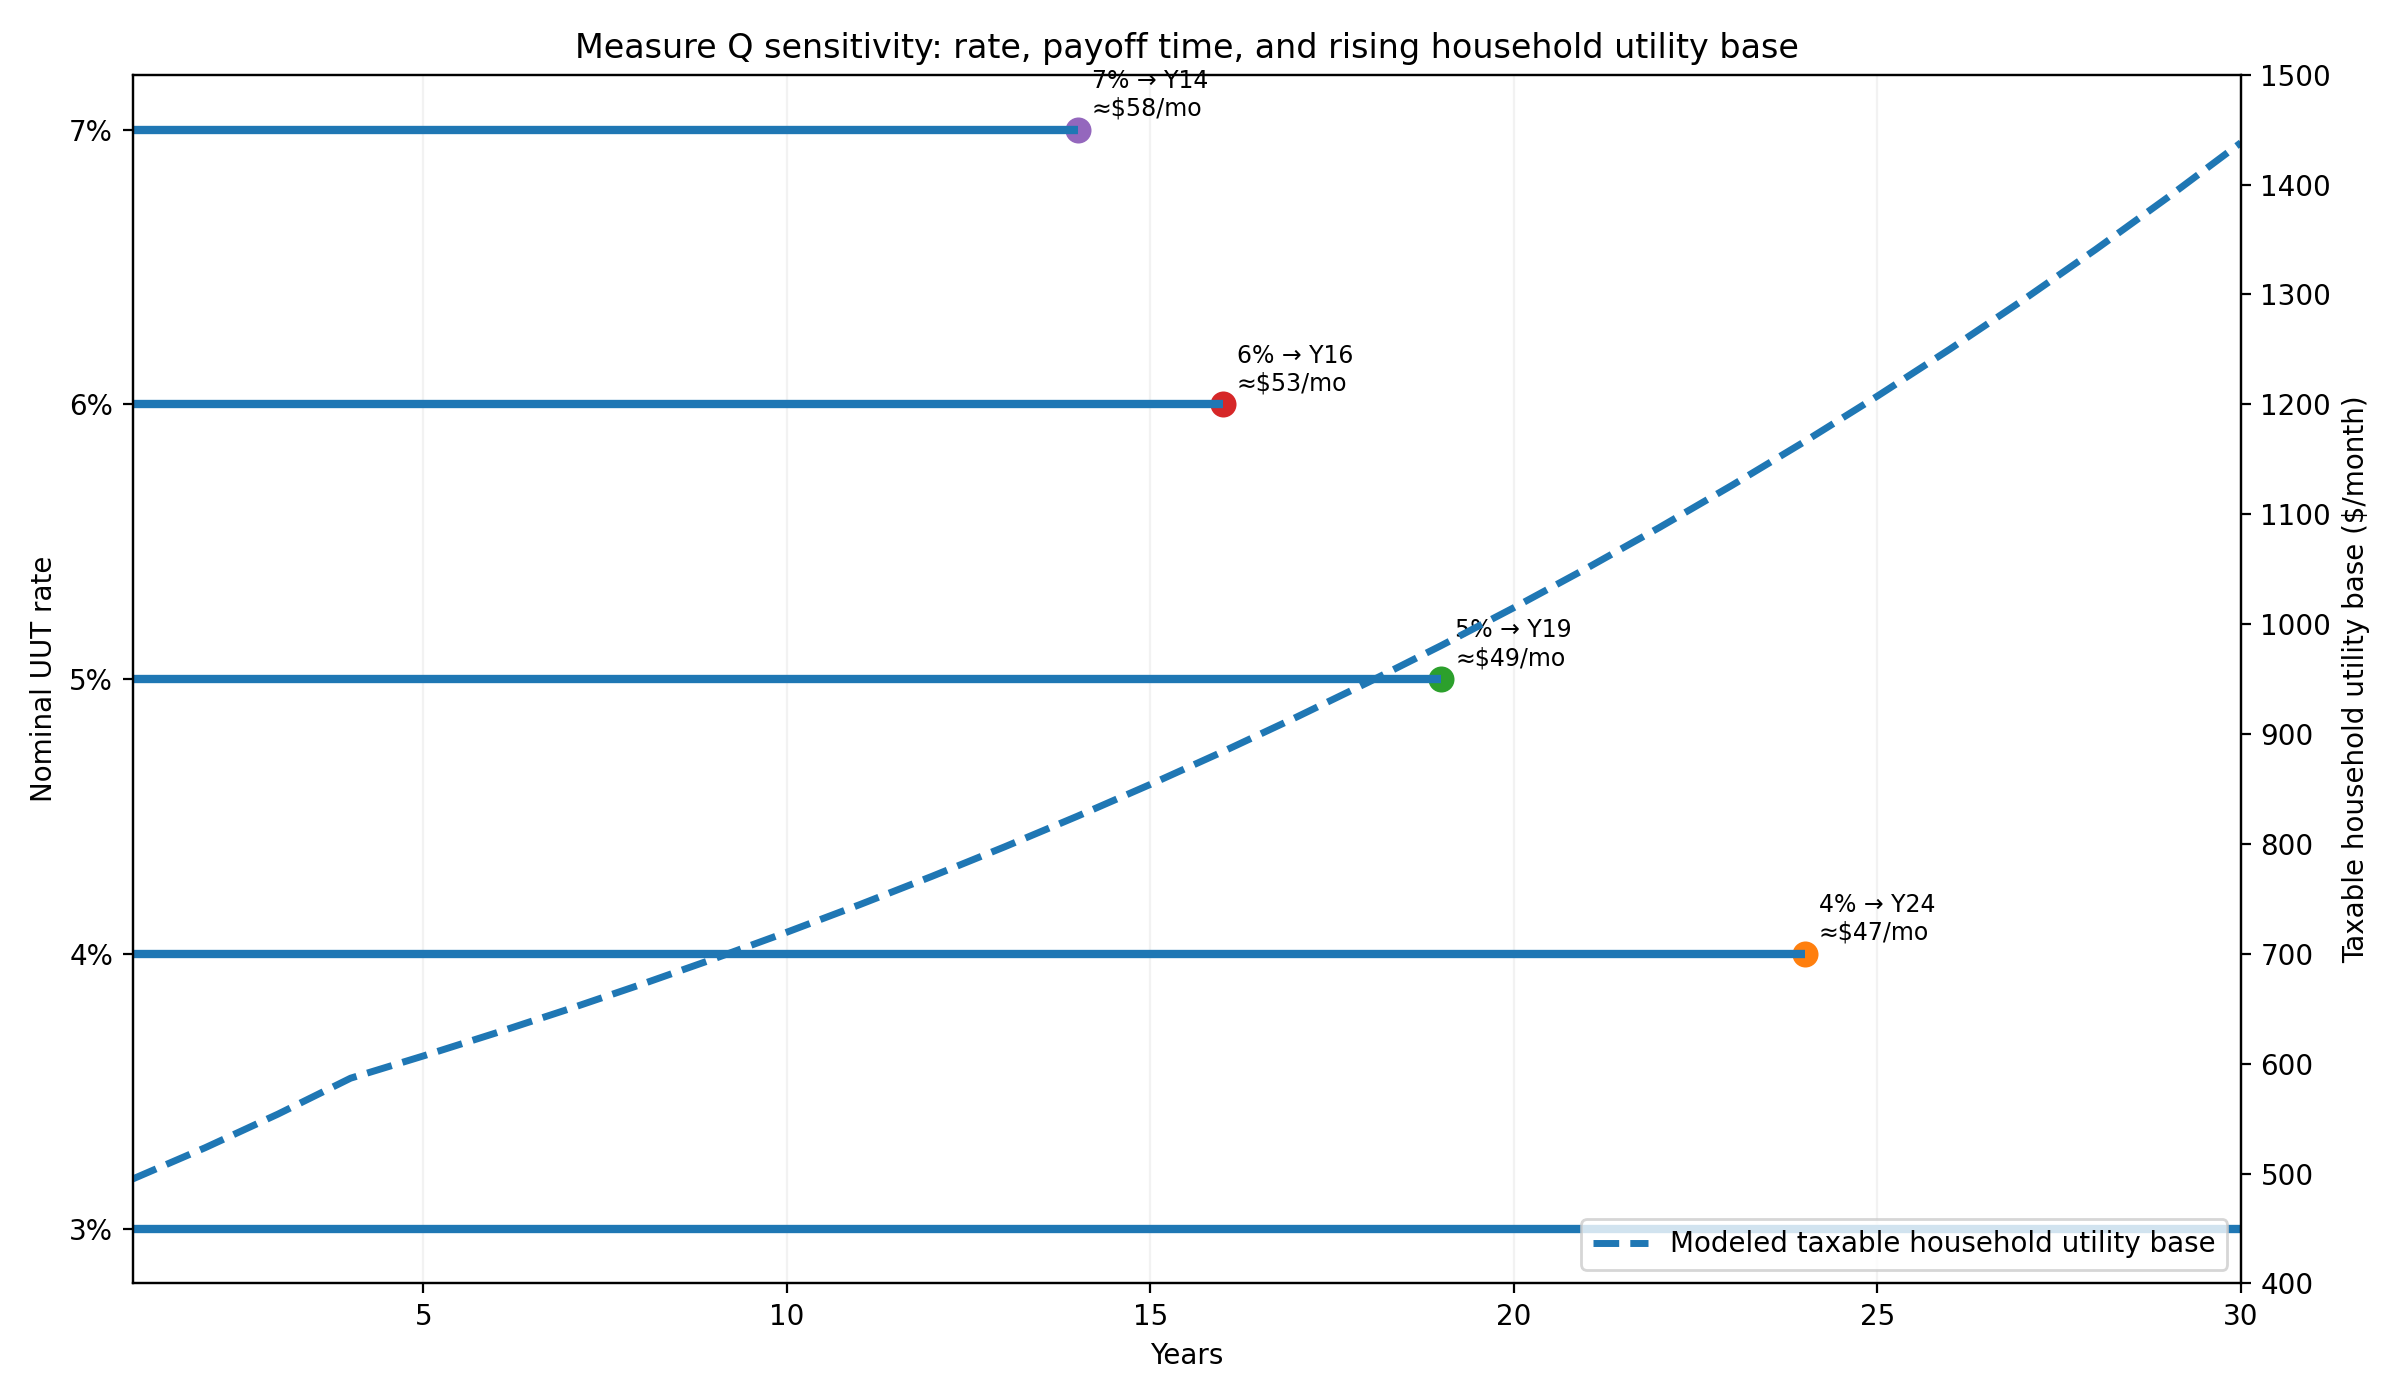
Modeled payoff: 7% Year 14, 6% Year 16, 5% Year 19, 4% Year 24, 3% Year 32. These are what-if results, not City forecasts.
General tax does not mean no controls
Measure Q is a general tax. The money raised is not restricted by law to the three facility projects and may be used for the public-safety, facility, street and other general City services identified in the measure. That flexibility is real.
Calling it an unchecked blank check leaves out controls in the measure. The City's published language requires the money to remain local, requires spending disclosures and independent audits, and states that the tax continues until ended by voters. The City also says the Council may reduce or suspend the tax.
Change the assumptions yourself
The interactive Measure Q debt model lets you enter a starting taxable household utility bill from $200 to $1,000 per month, choose a static or progressive tax base, and compare the 3% through 7% payoff curves.
Before connecting another City controversy to Measure Q
Marina has legitimate disputes about development agreements, parks, rentals, litigation, public records, old Council decisions and project delivery. A controversy does not automatically become a Measure Q funding fact.
| Test | Question to ask |
|---|---|
| Source | What primary record supports the claim, and what date or decision does it actually describe? |
| Context | Is a later outcome being compared with the facts, prices, contracts or law that existed when the decision was made? |
| Money | Is the amount unrestricted General Fund money that could actually be moved, or is it restricted, set aside, project-specific, future money raised or a negotiated obligation? |
| Magnitude | Even if the claim is correct, is the amount large enough to materially change the facilities funding problem? |
| Measure Q link | Does it change the tax, taxable base, facilities need, funding plan or available unrestricted resources? If not, keep it as a oversight issue rather than using it as a substitute for the Measure Q analysis. |
How do other City issues fit?
Parks, Preston Park, development incentives, litigation, recreation facilities and transportation projects can be legitimate questions without necessarily being the same financial question as Measure Q. Use the City Issues & Measure Q FAQ to see what is directly related, indirectly related, or financially separate.